
US Drug Test Centers Research Articles
Drugs In America
Which States Are Most Affected by Drug Use, Addiction & Drug Laws?
Between 1999 and 2017, more than 702,000 Americans died from drug overdoses. About a half-million people are incarcerated for drug offenses. Drug abuse and addiction cost the U.S. economy upwards of $250 billion per year. Violations like failed drug tests are responsible for returning about 350,000 people to jail or prison each year. [1, 2, 3, 4]
The effects of drug use on American society are widespread, from health and sickness to arrest and imprisonment to economic losses to stress and strain on family units. While the effectiveness of the decades-long war on drugs is debatable, the federal government spent more than $27 billion on drug control policies in 2017 alone. [5]
So there are many ways we can measure the impact of drugs at the national level, but do those trends hold up state-by-state, and which areas of the country are most deeply in the throes of the drug crisis?
To understand the drug crisis on a state level, we compared data for all 50 states and the District of Columbia across eight categories in four broad areas: illicit drug use, drug overdose deaths, substance use disorder and arrests for drug offenses. Each state was assigned a numerical value for each category such that lower numbers equate to a lower degree of trouble in the state over drug abuse. Jump to the bottom of the page to see the methodology for this study.
Best & Worst States
The two states that performed the best in our analysis were Kansas (No. 1) and Texas (No. 2). Both states had scores at least 24 points better than the next highest-scoring states. Out of a possible maximum score of 408, Kansas and Texas both had scores that were under 100. New Hampshire (No. 51) and West Virginia (No. 50) were the worst two states according to our analysis, with both scoring within 125 points of the highest possible score.
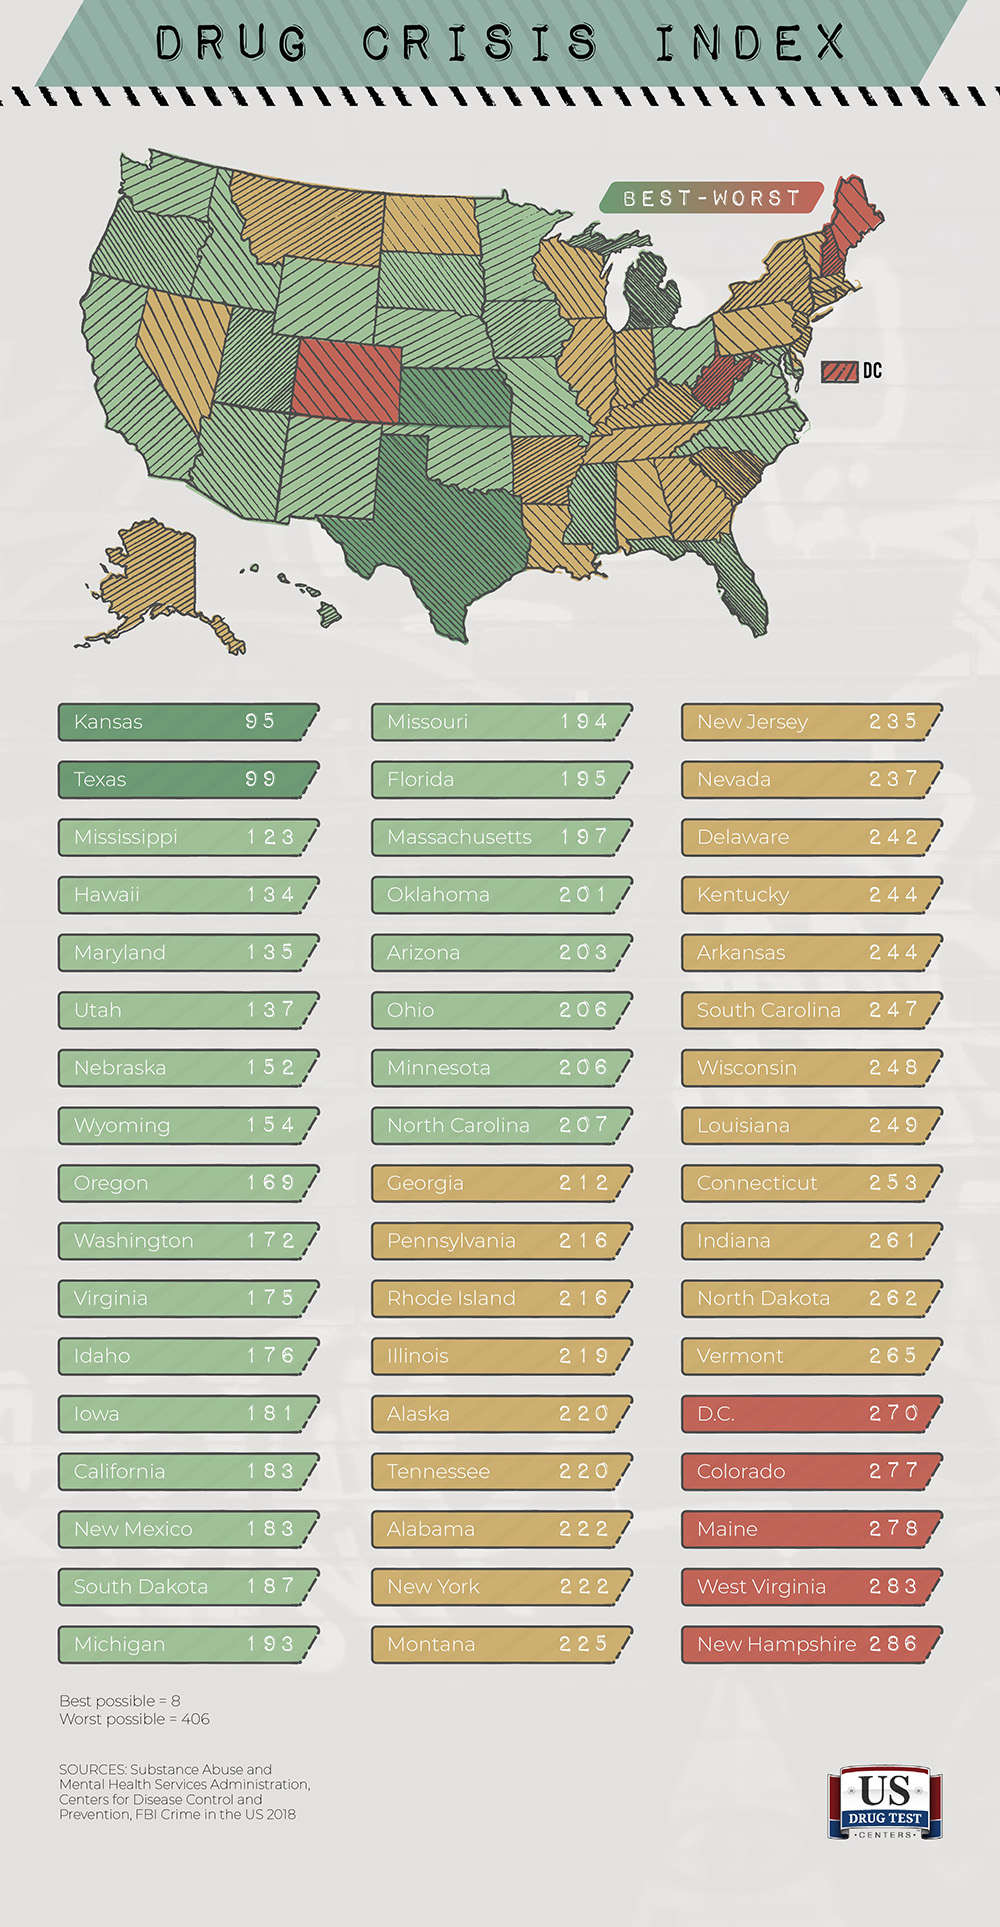
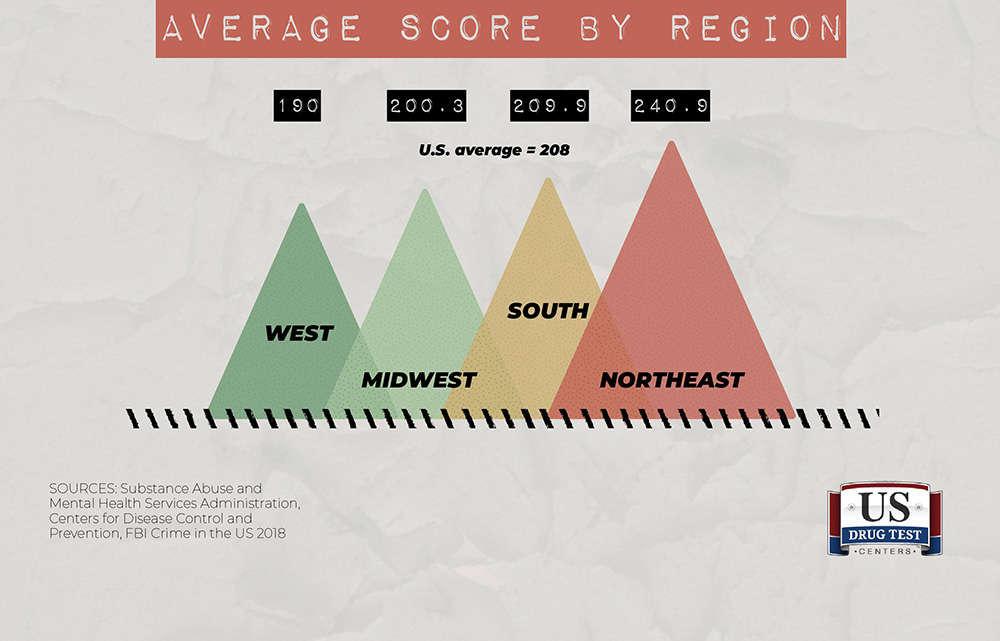
The Northeast is the only geographic region of the U.S. without a state among the 10 best on our Drug Crisis Index, and No. 20 Massachusetts is the best-scoring state in the region. The West has four states in the top 10, and the South has three. Overall, the national average score is 208, and the Northeast has only one state with a better-than-average score.
Drug Use
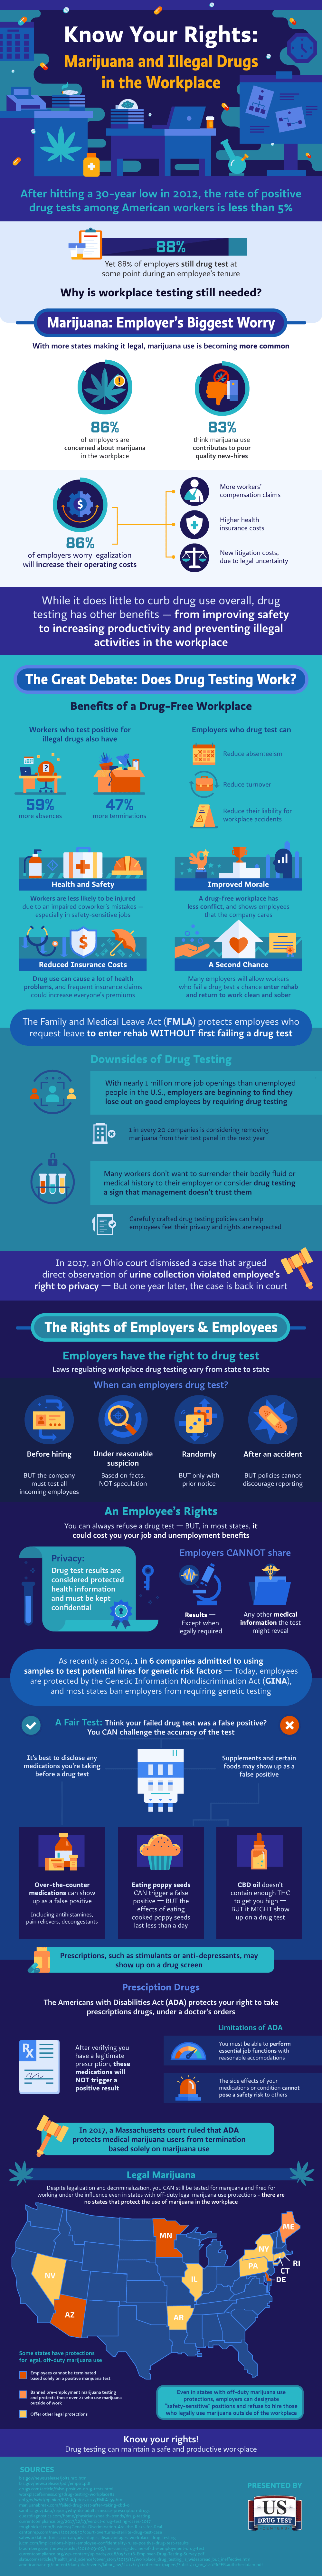
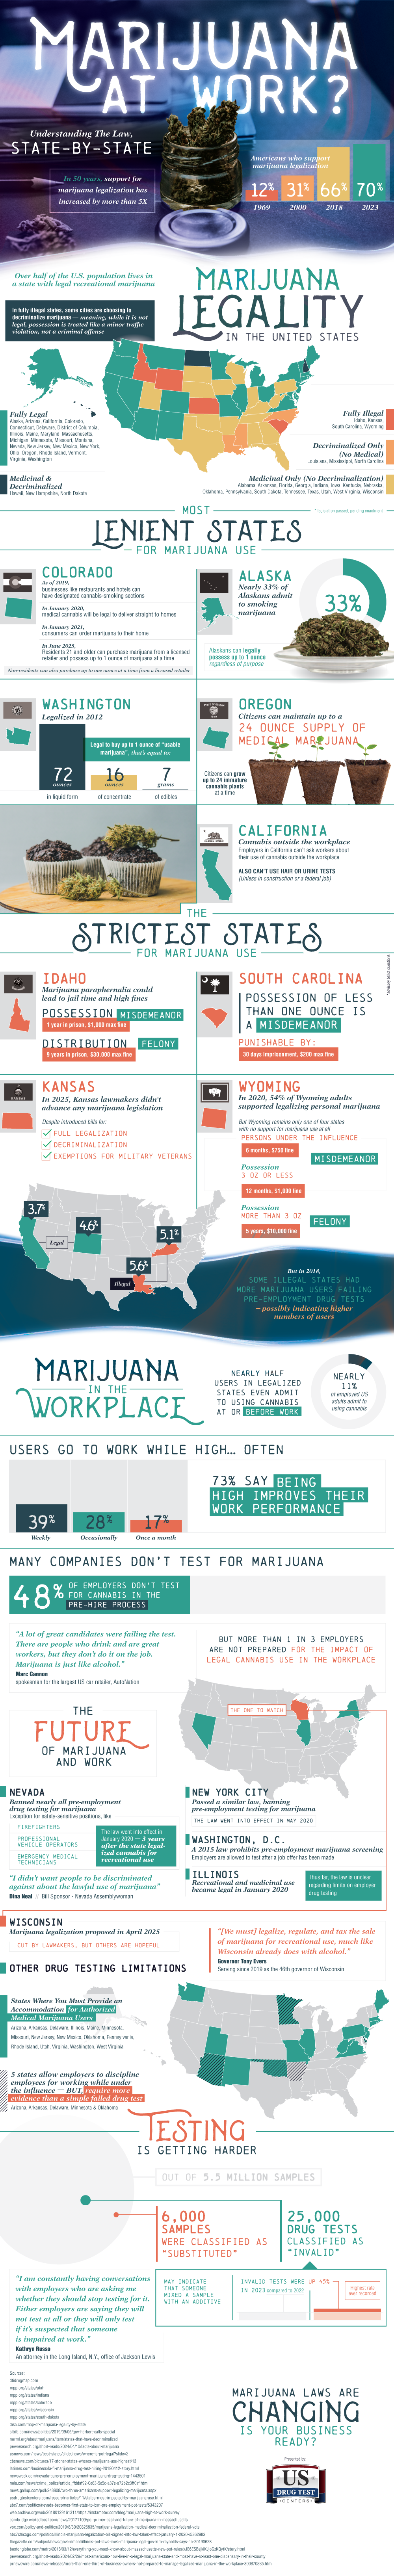
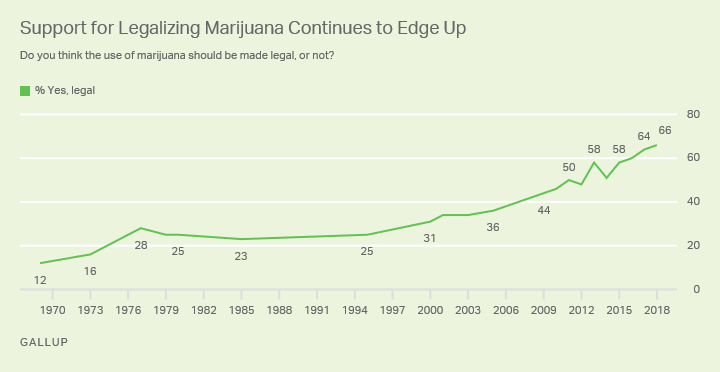
About two-thirds of Americans today support legalization of marijuana [6], but a similar percentage of people believe substance use is a major problem in their community. [7]
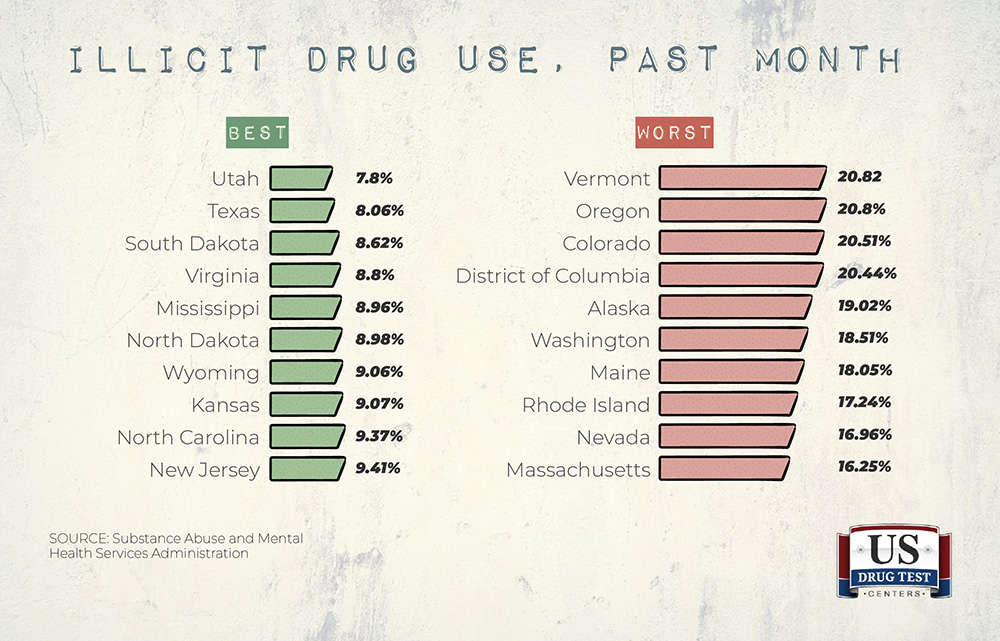
When it comes to the use of illicit drugs, which excludes things like alcohol but includes marijuana and cocaine, past-month use peaks in Vermont and Oregon and is at its lowest in Utah. [8]
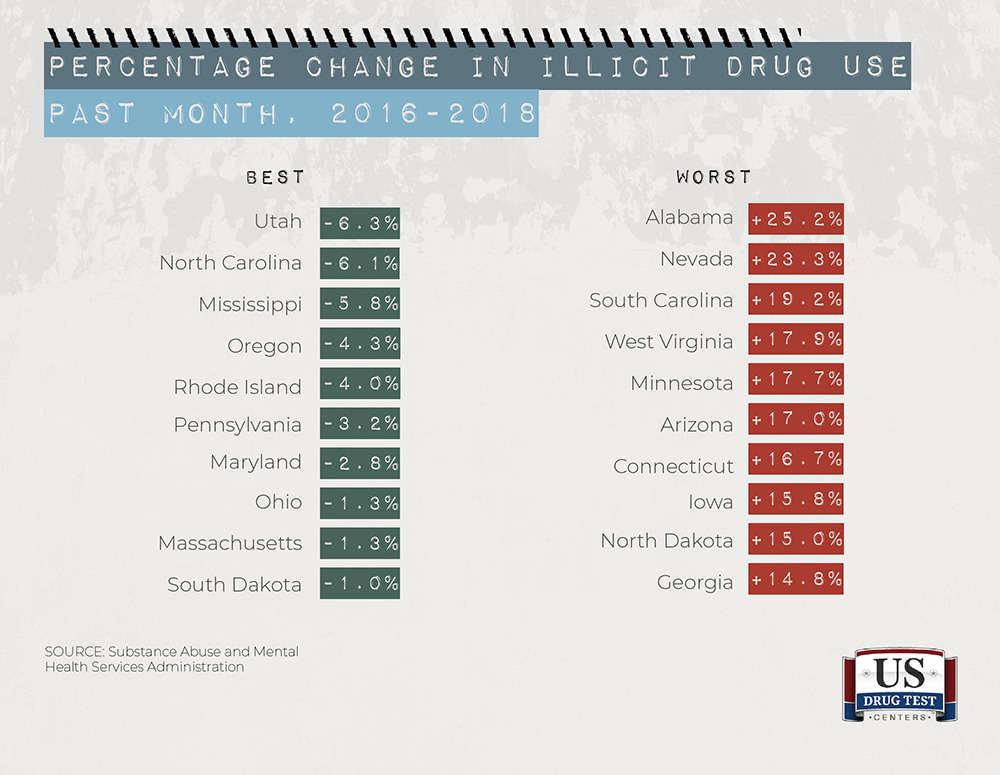
Only 11 states have seen the percentage of regular drug users fall over the past few years, with the lowest decline being recorded in Utah. The vast majority of states have seen drug use rise, with an average increase of about 9%, led by Alabama’s 25.2% increase.
For individuals who may be monitored by probation or parole programs or who could lose a job if they use an illicit drug, which could include pot smokers in states where weed is legal, regular drug use is a major problem. That’s because depending on the drug and type of drug test, substances can be detected as many as 90 days after last use.
Overdose Deaths
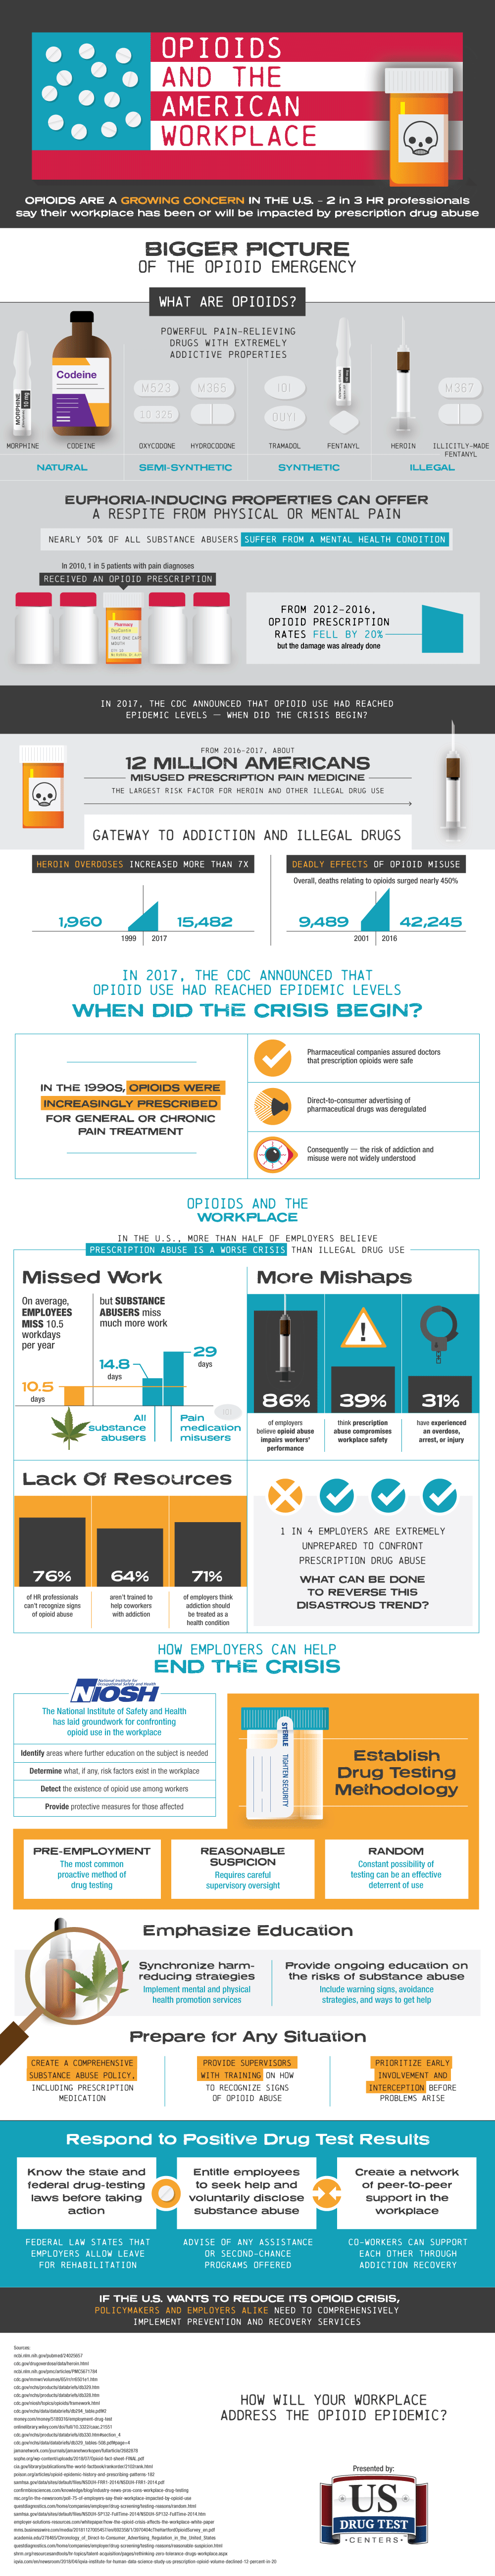
Drug overdoses have helped make accidents the third-leading cause of death in the United States, behind only heart disease and cancer. [9] About 70,000 people were killed by drug overdoses in 2017, the most recent year for which the Centers for Disease Control and Prevention has published data, and about 68% of those involved prescription drug or opioid abuse. [10]
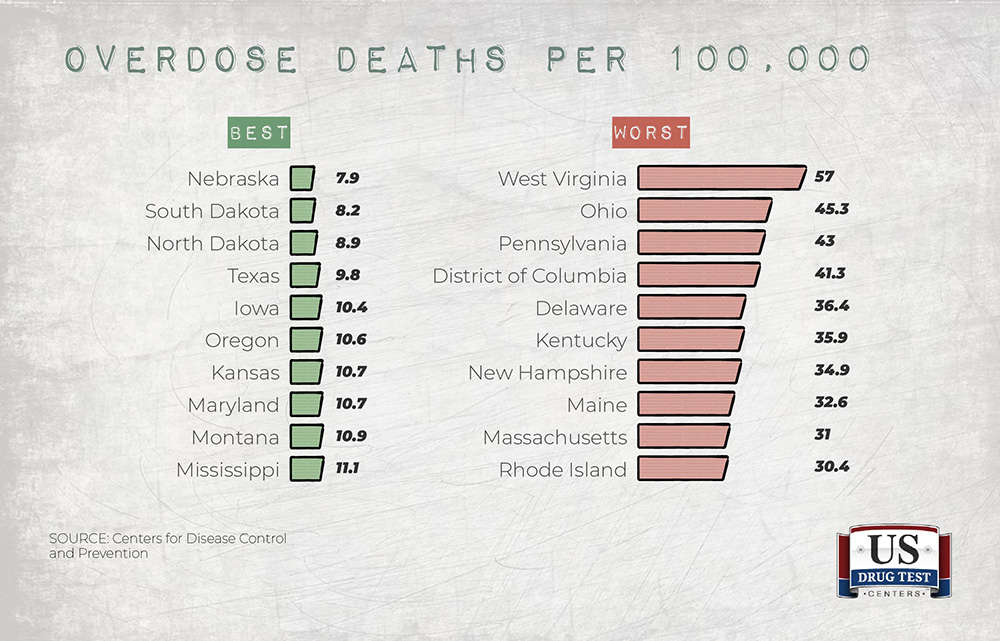
West Virginia has the highest age-adjusted rate of drug overdose deaths, with 57 deaths per 100,000 people, more than seven times higher than the rate of the No. 1 state in this category, Nebraska. [11]
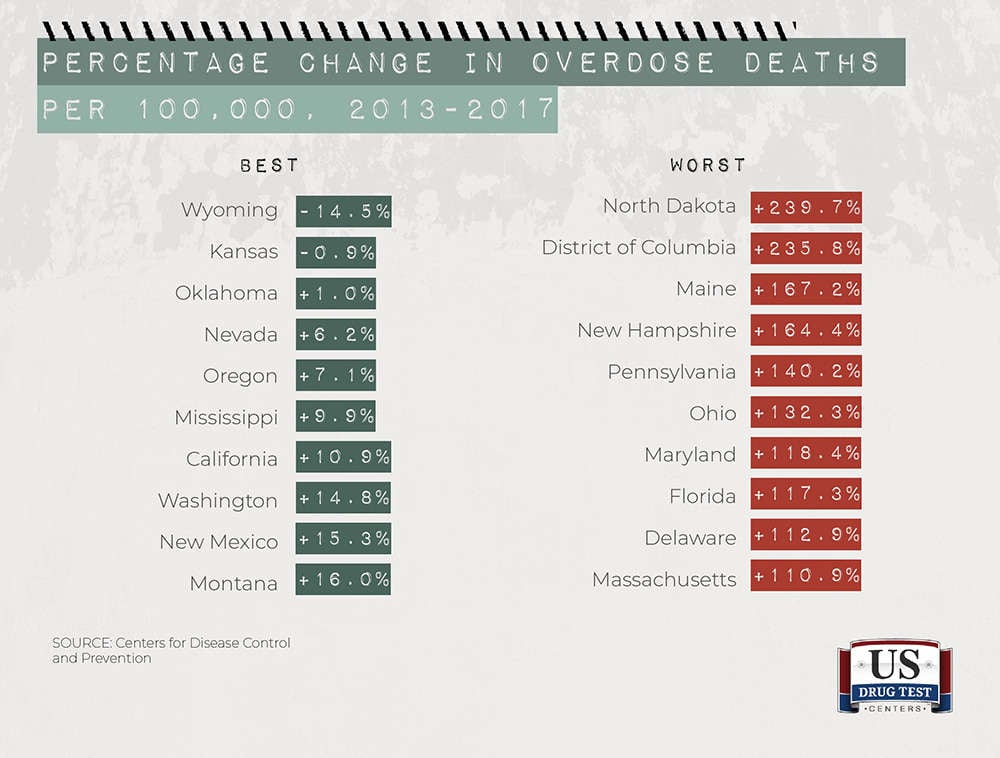
Only two states have seen drug overdose rates decline over the past few years — Wyoming and Kansas — and 11 states had increases of more than 100%.
Addiction & Substance Abuse
Alcohol abuse and drug addiction can impact the entire family, and an estimated 1 in 8 children have at least one parent with substance use disorder, which includes alcoholism and drug addiction. [12]
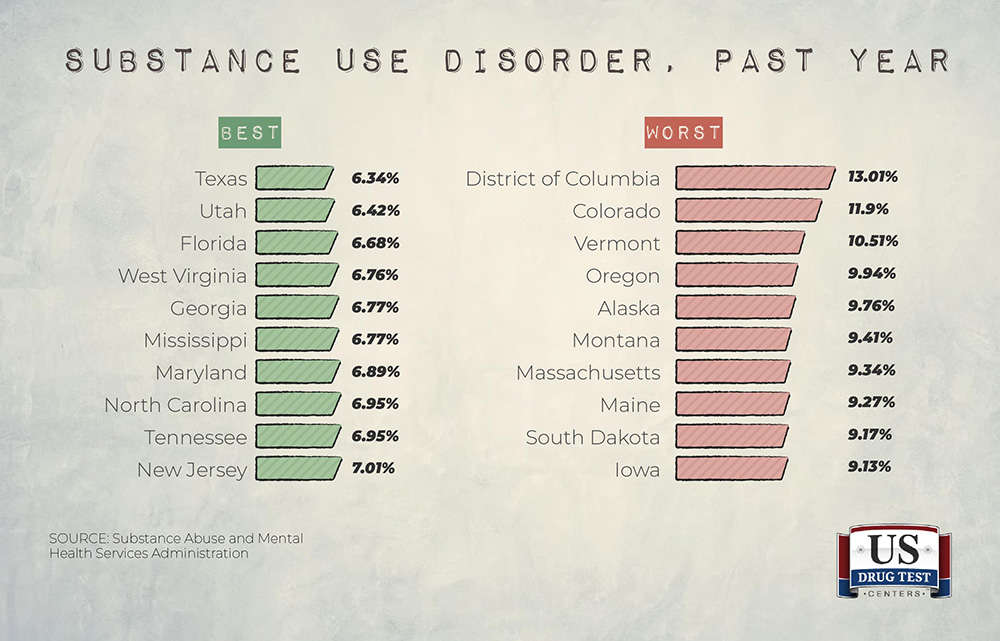
Substance use disorder is quite common, with almost 8% of adults having a substance use disorder in the past year, and while rates are highest in the District of Columbia, even the state with the lowest rate (Texas, 6.34%), isn’t too far off the national average of 7.7%.
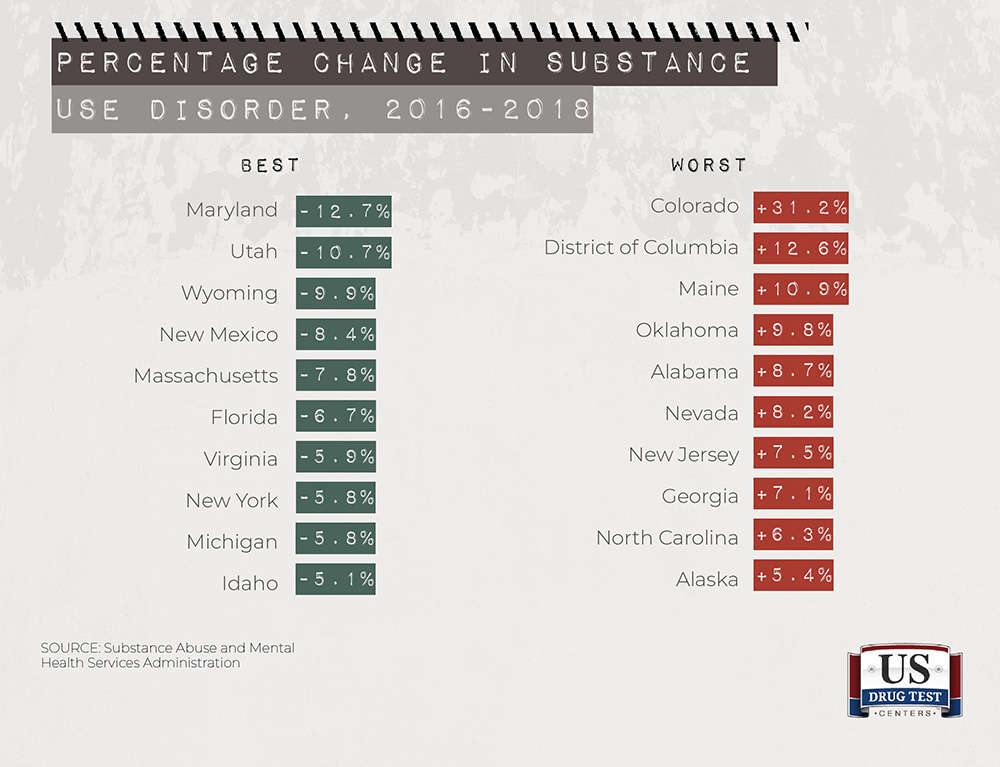
Just under half of the states have had a decline in past-year substance use disorder since 2016, while three areas have seen their rates go up by double digits.
Studies have indicated that substance use disorder rates are as many as nine times higher for people on probation or parole than for the general population [13], and both periodic and random drug testing is often seen as a deterrent to further crimes for those on probation or parole.
Drug Arrests
According to FBI statistics, about 16% of all arrests made in 2018 were for drug abuse violations, which includes the production, use and distribution of controlled substances. [14] About 49% of convictions of people in federal prison are for drug offenses. [15]
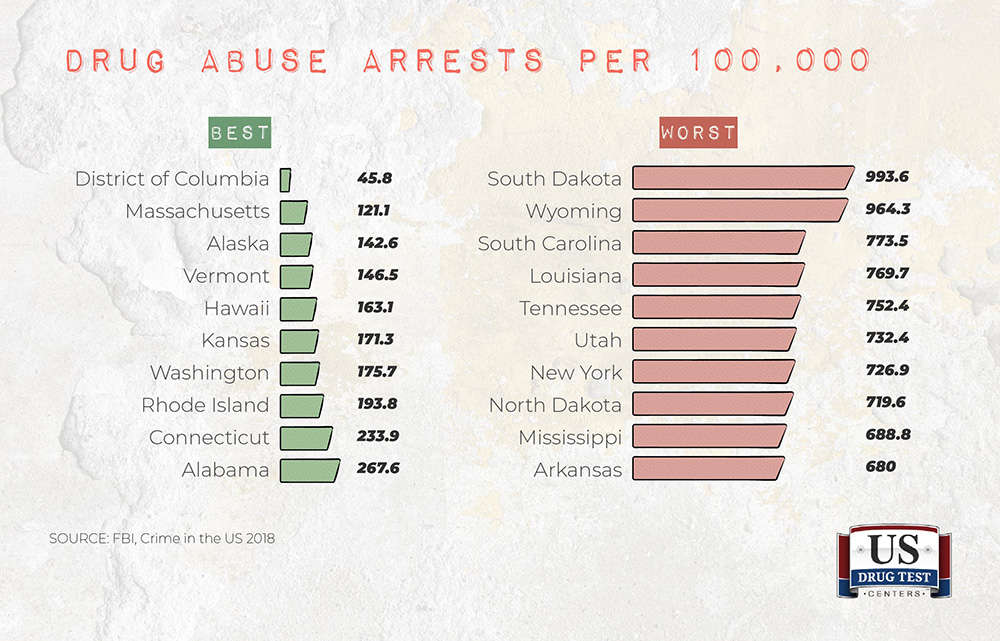
South Dakota and Wyoming have by far the highest rates of arrest for drugs, with both states about 200 points higher than the next-highest state, South Carolina. Drug arrests are least common Washington, D.C., by a huge margin. [16]
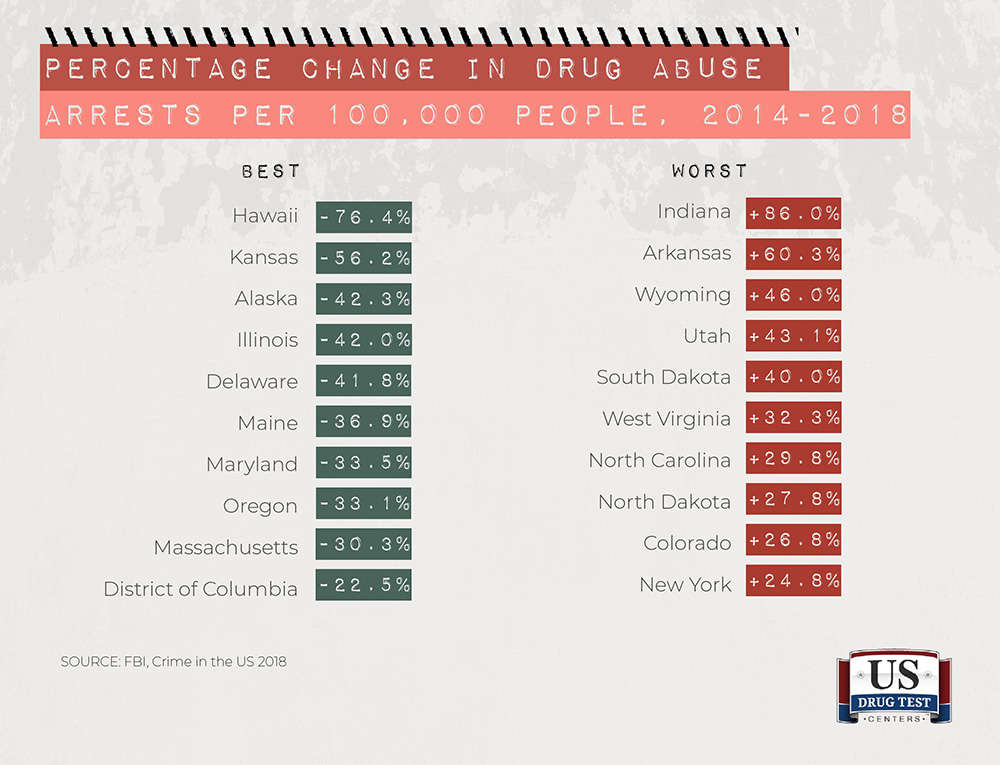
A total of 18 states have seen drug abuse arrests decline over the past half-decade for which data is available, led by a huge decline in arrests in Hawaii — a 76.4% decline. Arrests have gone up the most in Indiana, which saw an 86% increase in drug abuse arrests.
Methodology
As referenced at the beginning, we compared the 50 states and District of Columbia across several categories related to drug use.
To create our overall index figure, a numerical value was assigned to each state that indicated its relative position in each category, and those figures were totaled together. The result was that lower numbers indicated the effect on the state of drug use was less than for other states.
Here’s a look at the categories included and where the data came from:
- Substance Abuse and Mental Health Services Administration: Illicit drug use rates and change over time.
- CDC WONDER Database: Drug overdose death rates and change over time.
- FBI: Drug abuse arrest rate and change over time.
Resources
[1]
https://www.pdmpassist.org/pdf/Overdose%20Fatality%20Review%20-%20A%20Practitioner's%20Guide%20to%20Implementation.pdf
[2]
https://www.prisonpolicy.org/reports/pie2019.html
[3]
https://www.drugabuse.gov/related-topics/trends-statistics
[4]
https://www.pewtrusts.org/en/research-and-analysis/issue-briefs/2018/09/probation-and-parole-systems-marked-by-high-stakes-missed-opportunities
[5]
https://fas.org/sgp/crs/misc/IN10912.pdf
[6]
https://www.pewresearch.org/fact-tank/2019/11/14/americans-support-marijuana-legalization/
[7]
http://www.apnorc.org/projects/Pages/HTML%20Reports/american-attitudes-toward-substance-use-in-the-united-states.aspx
[8]
https://www.samhsa.gov/data/sites/default/files/reports/rpt23236/NSDUHsaeShortTermCHG2018_1/NSDUHsaeShortTermCHG2018.pdf
[9]
https://www.cdc.gov/nchs/products/databriefs/db328.htm
[10]
https://www.cdc.gov/drugoverdose/index.html
[11]
https://wonder.cdc.gov/ucd-icd10.html
[12]
https://www.samhsa.gov/data/sites/default/files/report_3223/ShortReport-3223.html
[13]
https://www.ncbi.nlm.nih.gov/pmc/articles/PMC5037016/
[14]
https://ucr.fbi.gov/crime-in-the-u.s/2018/crime-in-the-u.s.-2018/tables/table-29
[15]
http://apps.urban.org/features/reducing-federal-mass-incarceration/
[16]
https://ucr.fbi.gov/crime-in-the-u.s/2018/crime-in-the-u.s.-2018/tables/table-69
Fair Use Statement
All the research and analysis on this page is free to share for noncommercial purposes. If you do wish to distribute the information you’ve seen, please provide a link to the URL at the top of this page to give our author credit.