US Drug Test Centers Research Articles
The Economics of Marijuana
How Much Have States Made From Weed Taxes, and at What Cost?
In 17 states, recreational marijuana has been decriminalized or fully legalized. Ten states have established systems to charge marijuana sellers and buyers taxes to fund a variety of services.
Of the states where weed is legal, the majority are still working out structures for establishing and collecting marijuana taxes, which includes sales tax, cultivation tax and other excise taxes.
Colorado and Washington were the first states to fully decriminalize marijuana, with both states passing ballot measures in 2012, and Colorado’s weed dispensary industry was the first to become operational in 2014.
Given that it’s been nearly a decade since Colorado blazed the trail, what do we know about the economic impact of legal, taxed marijuana and if there have been unintended consequences? To understand, we analyze state tax revenue data for all available years, as well as marijuana use data reported by federal authorities.
Read on for our full analysis and take a look at some key findings below:
- In 2020, marijuana taxes contributed nearly $2.5 billion to state coffers.
- That sum ranges in the impact on state budgets, from a low of 0.01% of Maine’s total tax revenue in fiscal year 2020 to 2.7% in Colorado.
- Fewer adults perceive marijuana as being dangerous (about 25% vs. 28% five years ago), and adolescents’ perception of weed as risky has also fallen but by a lower rate.
- Twenty-three states have seen regular marijuana use by those between 12 and 17 rise over the past half-decade, including eight of the 17 states with legal weed. In all states, regular use of marijuana by adults, defined as using it in the past month, has gone up.
Where Is Marijuana Legal?
Seventeen states have legalized or decriminalized marijuana for recreational use, and many more allow medical marijuana. Five states legalized marijuana in 2020, and New York made it legal in 2021. It’s also decriminalized in the District of Columbia, but it’s not legal to sell it there.
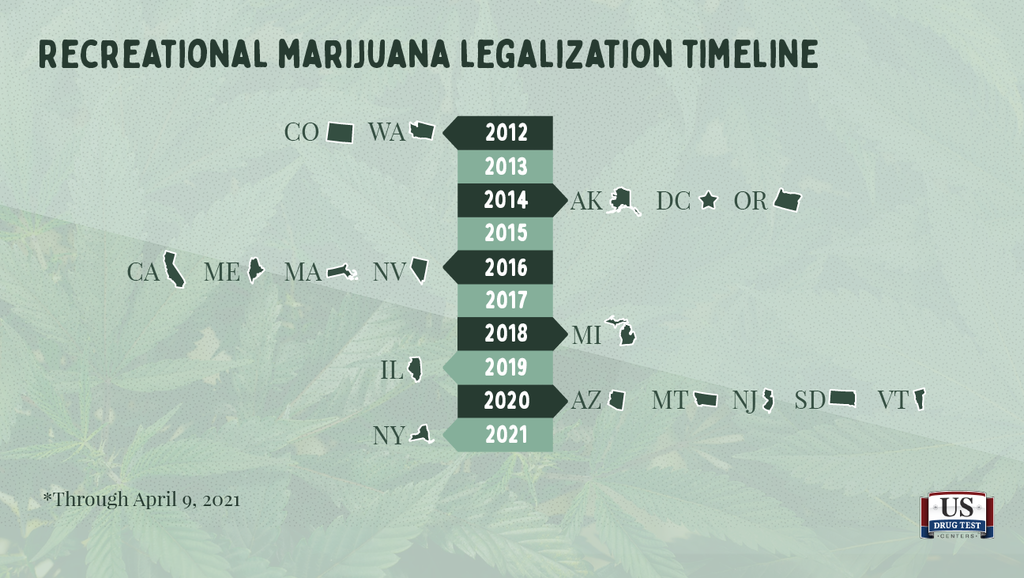
| Colorado | 2012 |
| Washington | 2012 |
| Alaska | 2014 |
| District of Columbia | 2014 |
| Oregon | 2014 |
| California | 2016 |
| Maine | 2016 |
| Massachusetts | 2016 |
| Nevada | 2016 |
| Michigan | 2018 |
| Illinois | 2019 |
| Arizona | 2020 |
| Montana | 2020 |
| New Jersey | 2020 |
| South Dakota | 2020 |
| Vermont | 2020 |
| New York | 2021 |
A combined 130 million Americans live in states where recreational marijuana is legal for adults, though not all of these states collect sales, excise and other taxes on sales. Still, that means that about one in three Americans resides in a legal-weed state.
Economic Impact of Marijuana
In 10 states with recreational marijuana, taxes are collected on the sale and purchase of weed. How states spend the money varies, as does the amount collected and its impact on state funds.
Combined in 2020, those states collected $2.5 billion in taxes from marijuana sales, some of which includes medicinal dispensaries. California collected more than $1 billion in 2020, the highest among states that collect weed taxes, while Alaska took in about $24 million.
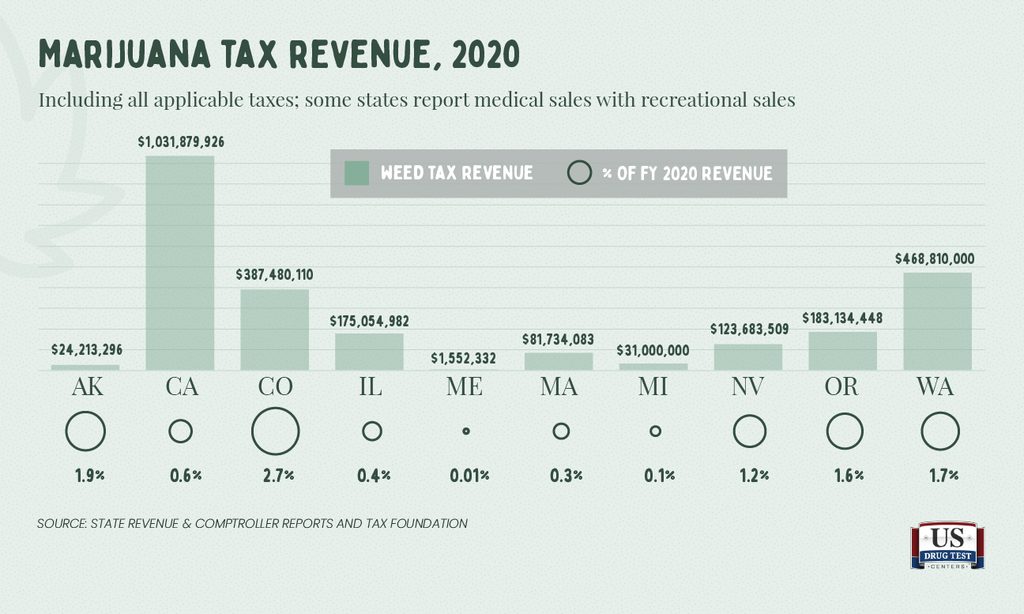
| California | $1,031,879,926 | 0.6% |
| Washington | $468,810,000 | 1.7% |
| Colorado | $387,480,110 | 2.7% |
| Oregon | $183,134,448 | 1.6% |
| Illinois | $174,884,334 | 0.4% |
| Nevada | $123,683,509 | 1.2% |
| Massachusetts | $81,734,083 | 0.3% |
| Michigan | $31,000,000 | 0.1% |
| Alaska | $24,213,296 | 1.9% |
| Maine | $1,552,332 | 0.01% |
In Arizona, where voters approved a legalization measure in 2020, the state agency collected more than a half-million dollars in marijuana taxes in January 2021, the first month of sales. Taxation of recreational marijuana started in Maine in 2020, with tax collections totaling more than $1.5 million in less than a year.
Of course, regardless of state laws, marijuana remains illegal on the federal level, though more states are expected to decriminalize the drug this year, including New Mexico and Virginia, where legislators have passed bills that have yet to be signed or vetoed by their respective governors.
Where does this money go? Here’s a look at some ways states spend their cannabis cash:
- Alaska: Marijuana tax revenue is split between the state’s general fund and programs to provide drug treatment and prevent recidivism.
- Colorado: About 13% of marijuana revenue helps fund the state’s public schools.
- Massachusetts: Structure includes a local-option tax for cities and towns where weed stores are located, which gives communities the ability to collect taxes up to 3% on marijuana purchases.
- Nevada: Emergency savings, schools and local governments.
- Oregon: Tax structure benefits mental health and drug abuse services, county and local law enforcement and the state police.
Learn more about how marijuana taxes vary by state here.
Cultural Impact of Legal Marijuana
The changing societal views on marijuana are well-known, and perhaps the biggest evidence for them is the mounting number of states that have voted, whether through the people or their representatives, to decriminalize the drug.
According to a 2021 survey by The Hill, 38% of people say the federal government should legalize marijuana, while another 37% said the states should decide. Only a quarter of people said they felt weed should remain illegal everywhere.
It shouldn’t come as much surprise, then, to learn that marijuana use is on the rise among some groups, even in states where it’s not legal for anybody to use the drug.
The most recent estimates from the Substance Abuse and Mental Health Services Administration indicate that about 17% of American adults have used marijuana in the past year, while a smaller percentage used it in the past month (11%). About one in four adults, nearly identical to the number in The Hill survey who said weed should remain illegal, perceive marijuana use to be a great risk.
Use is increasing among American adults, with every state seeing an increase in the percentage of regular pot use, meaning use in the past month.
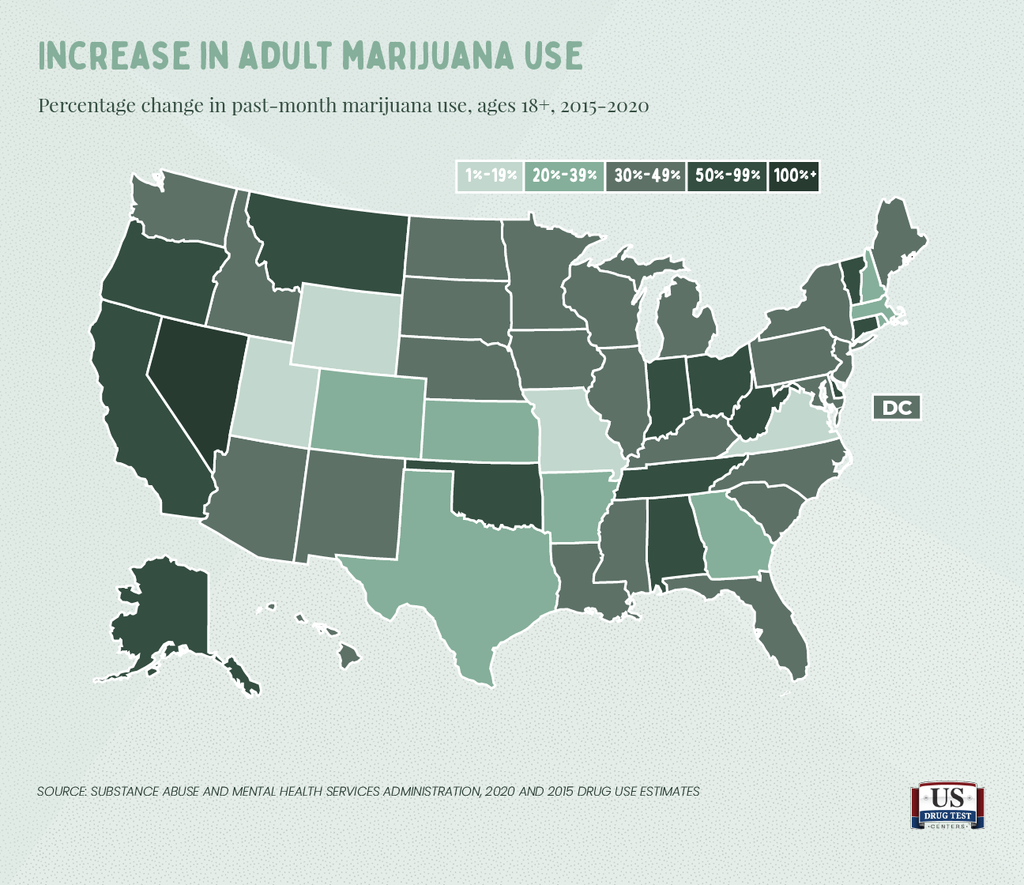
| Increase in adult past-month marijuana use by state, 2015-2020 | |
| Nevada | 116% |
| Oklahoma | 67% |
| Tennessee | 64% |
| Alabama | 59% |
| Indiana | 57% |
| Oregon | 54% |
| Delaware | 54% |
| West Virginia | 52% |
| Vermont | 51% |
| Montana | 51% |
| Ohio | 51% |
| California | 51% |
| Connecticut | 50% |
| Alaska | 50% |
| Nebraska | 48% |
| Kentucky | 47% |
| New Jersey | 46% |
| Wisconsin | 45% |
| South Carolina | 42% |
| Washington | 42% |
| Minnesota | 41% |
| Maine | 40% |
| Idaho | 40% |
| North Carolina | 40% |
| Pennsylvania | 39% |
| Michigan | 39% |
| Illinois | 39% |
| Mississippi | 38% |
| Florida | 37% |
| North Dakota | 37% |
| South Dakota | 36% |
| Iowa | 36% |
| New York | 32% |
| Maryland | 32% |
| District of Columbia | 32% |
| Hawaii | 32% |
| New Mexico | 31% |
| Arizona | 30% |
| Louisiana | 30% |
| Arkansas | 29% |
| Massachusetts | 28% |
| New Hampshire | 25% |
| Texas | 24% |
| Rhode Island | 23% |
| Kansas | 21% |
| Georgia | 20% |
| Colorado | 20% |
| Utah | 19% |
| Wyoming | 19% |
| Virginia | 17% |
| Missouri | 14% |
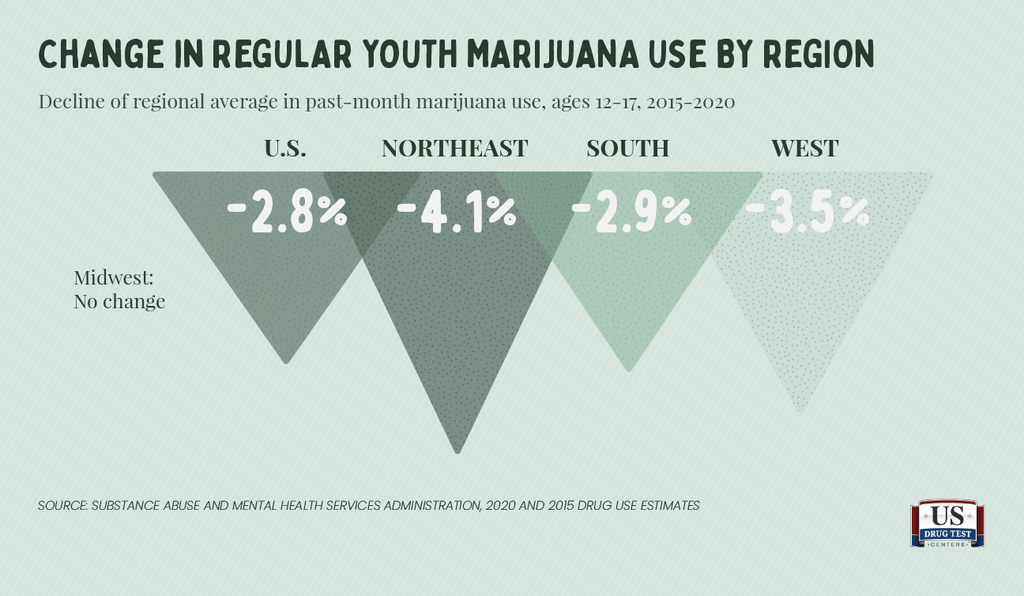
While marijuana use has increased among adults over the past half-decade, at least on a national level, it’s gone down among youths, though the change has been slight, and many states have seen huge jumps in adolescents using weed.
Notably, in the regions where legal-weed states are largely clustered, the West and Northeast, marijuana use among young people has declined the most.
| Total U.S. | -2.8% |
| Northeast | -4.1% |
| Midwest | — |
| South | -2.9% |
| West | -3.5% |
What about youth marijuana use in states where the drug is legal for adults? This is a mixed bag. Weed use by adolescents has climbed by about 21% in Nevada, but it’s gone down by just over 22% in Colorado. Eight of the 17 states where marijuana use is legal for adults have seen use of the drug by young people drop.
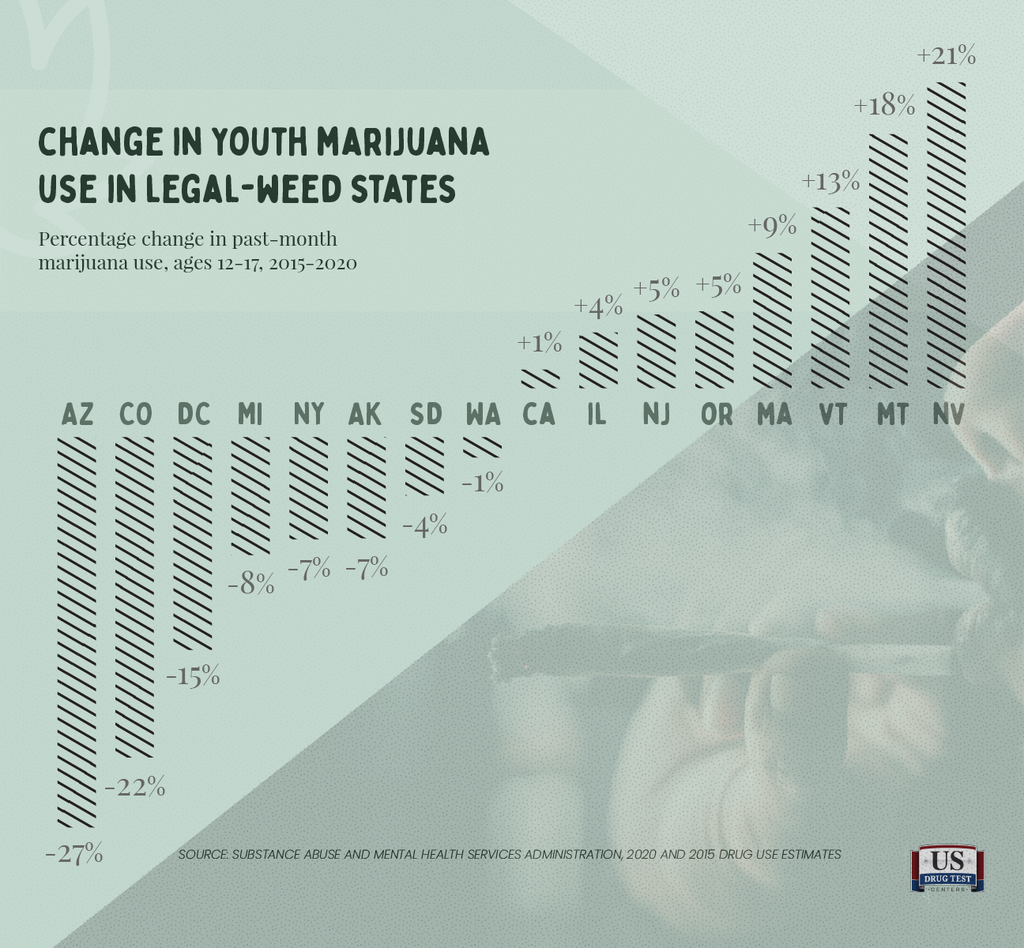
| Arizona | -27% |
| Colorado | -22% |
| District of Columbia | -15% |
| Michigan | -8% |
| New York | -7% |
| Alaska | -7% |
| South Dakota | -4% |
| Washington | -1% |
| California | +1% |
| Illinois | +4% |
| New Jersey | +5% |
| Oregon | +5% |
| Massachusetts | +9% |
| Vermont | +13% |
| Montana | +18% |
| Nevada | +21% |
Where Does Your State Rank for Marijuana Use?
Vermont has the highest rate of past-month weed use for both young people and adults, while Utah ranks 51st and 50th, respectively, for recent adolescent and adult marijuana use. See the table below for your state’s marijuana use rates and ranks.
| States by past-month marijuana use/rank and percentage change in past-month use/rank, 2015-2020 | ||||||||
|---|---|---|---|---|---|---|---|---|
| State | Age 12-17 | Rank | Age 18+ | Rank | Age 12-17 % change | Rank | Age 18+ % change | Rank |
| Total U.S. | 7% | - | 11% | - | -3% | - | 39% | - |
| Alabama | 6% | 42 | 9% | 38 | 16% | 6 | 59% | 4 |
| Alaska | 9% | 12 | 18% | 4 | -7% | 32 | 50% | 14 |
| Arizona | 6% | 34 | 12% | 19 | -27% | 51 | 30% | 38 |
| Arkansas | 6% | 41 | 9% | 40 | -6% | 31 | 29% | 40 |
| California | 9% | 11 | 14% | 14 | 1% | 21 | 51% | 12 |
| Colorado | 10% | 7 | 18% | 5 | -22% | 49 | 20% | 47 |
| Connecticut | 7% | 17 | 13% | 15 | -6% | 30 | 50% | 13 |
| Delaware | 8% | 14 | 13% | 17 | 0% | 22 | 54% | 7 |
| District of Columbia | 9% | 10 | 17% | 7 | -15% | 44 | 32% | 35 |
| Florida | 6% | 29 | 10% | 26 | -14% | 42 | 37% | 29 |
| Georgia | 6% | 34 | 10% | 31 | 0% | 24 | 20% | 46 |
| Hawaii | 6% | 31 | 10% | 25 | -18% | 48 | 32% | 36 |
| Idaho | 6% | 37 | 9% | 39 | -8% | 34 | 40% | 23 |
| Illinois | 7% | 22 | 11% | 22 | 4% | 19 | 39% | 27 |
| Indiana | 8% | 16 | 12% | 18 | 15% | 7 | 57% | 5 |
| Iowa | 6% | 43 | 7% | 49 | 10% | 10 | 36% | 32 |
| Kansas | 5% | 48 | 8% | 46 | -15% | 43 | 21% | 45 |
| Kentucky | 6% | 32 | 10% | 29 | 10% | 11 | 47% | 16 |
| Louisiana | 5% | 49 | 8% | 44 | -10% | 39 | 30% | 39 |
| Maine | 11% | 2 | 18% | 6 | 10% | 9 | 40% | 22 |
| Maryland | 7% | 20 | 11% | 20 | -12% | 40 | 32% | 34 |
| Massachusetts | 10% | 8 | 15% | 11 | 9% | 12 | 28% | 41 |
| Michigan | 7% | 18 | 14% | 13 | -8% | 36 | 39% | 26 |
| Minnesota | 7% | 28 | 10% | 27 | -3% | 27 | 41% | 21 |
| Mississippi | 6% | 45 | 8% | 43 | 1% | 20 | 38% | 28 |
| Missouri | 6% | 38 | 9% | 34 | -9% | 38 | 14% | 51 |
| Montana | 10% | 6 | 15% | 10 | 18% | 5 | 51% | 10 |
| Nebraska | 7% | 24 | 9% | 41 | 22% | 3 | 48% | 15 |
| Nevada | 10% | 9 | 17% | 8 | 21% | 4 | 116% | 1 |
| New Hampshire | 8% | 15 | 15% | 12 | -17% | 47 | 25% | 42 |
| New Jersey | 7% | 25 | 9% | 36 | 5% | 18 | 46% | 17 |
| New Mexico | 10% | 5 | 13% | 16 | 23% | 2 | 31% | 37 |
| New York | 7% | 19 | 11% | 21 | -7% | 33 | 32% | 33 |
| North Carolina | 7% | 23 | 9% | 33 | 6% | 16 | 40% | 24 |
| North Dakota | 5% | 50 | 8% | 45 | -15% | 45 | 37% | 30 |
| Ohio | 6% | 30 | 11% | 23 | 7% | 13 | 51% | 11 |
| Oklahoma | 6% | 40 | 11% | 24 | 6% | 15 | 67% | 2 |
| Oregon | 11% | 3 | 19% | 2 | 5% | 17 | 54% | 6 |
| Pennsylvania | 6% | 33 | 10% | 28 | -13% | 41 | 39% | 25 |
| Rhode Island | 8% | 13 | 16% | 9 | -22% | 50 | 23% | 44 |
| South Carolina | 7% | 27 | 9% | 32 | 7% | 14 | 42% | 19 |
| South Dakota | 5% | 47 | 6% | 51 | -4% | 28 | 36% | 31 |
| Tennessee | 6% | 44 | 9% | 37 | 0% | 23 | 64% | 3 |
| Texas | 6% | 36 | 7% | 48 | -3% | 26 | 24% | 43 |
| Utah | 5% | 51 | 7% | 50 | -15% | 46 | 19% | 48 |
| Vermont | 13% | 1 | 20% | 1 | 13% | 8 | 51% | 9 |
| Virginia | 5% | 46 | 8% | 42 | -8% | 35 | 17% | 50 |
| Washington | 10% | 4 | 18% | 3 | -1% | 25 | 42% | 20 |
| West Virginia | 7% | 21 | 10% | 30 | 26% | 1 | 52% | 8 |
| Wisconsin | 7% | 26 | 9% | 35 | -8% | 37 | 45% | 18 |
| Wyoming | 6% | 38 | 8% | 47 | -5% | 29 | 19% | 49 |
Conclusion
Even as more voters and lawmakers embrace the notion of removing legal restrictions on the use and sale of marijuana, the drug remains illegal on the federal level, though some Democratic senators have suggested they will pursue legislation in Congress to make marijuana legal federally.
Still, the majority of Americans live in states where the drug is not legal, and even in places where it is, there does not seem to have been a massive increase in pot use, judging by both drug use statistics and tax collections.
About This Story
The state tax revenue included in this analysis was gathered directly from state government websites that list excise, sales, cultivation and other taxes levied against sellers, buyers and growers of marijuana.
Where possible, we used calendar-year data, but only fiscal year data was available for Massachusetts, Michigan and Nevada.
Estimates of drug use and perceptions of marijuana’s risks were from the most recent publication by the Substance Abuse and Mental Health Administration. Their most recent data was published in December 2020, and we used the same publication from 2015 for comparisons. These federal reports cover two-year periods, usually the two years prior to their release, so the 2020 data covers surveys conducted over the two-year period between 2018 and 2019.