US Drug Test Centers Research Articles
Worst States for DUIs
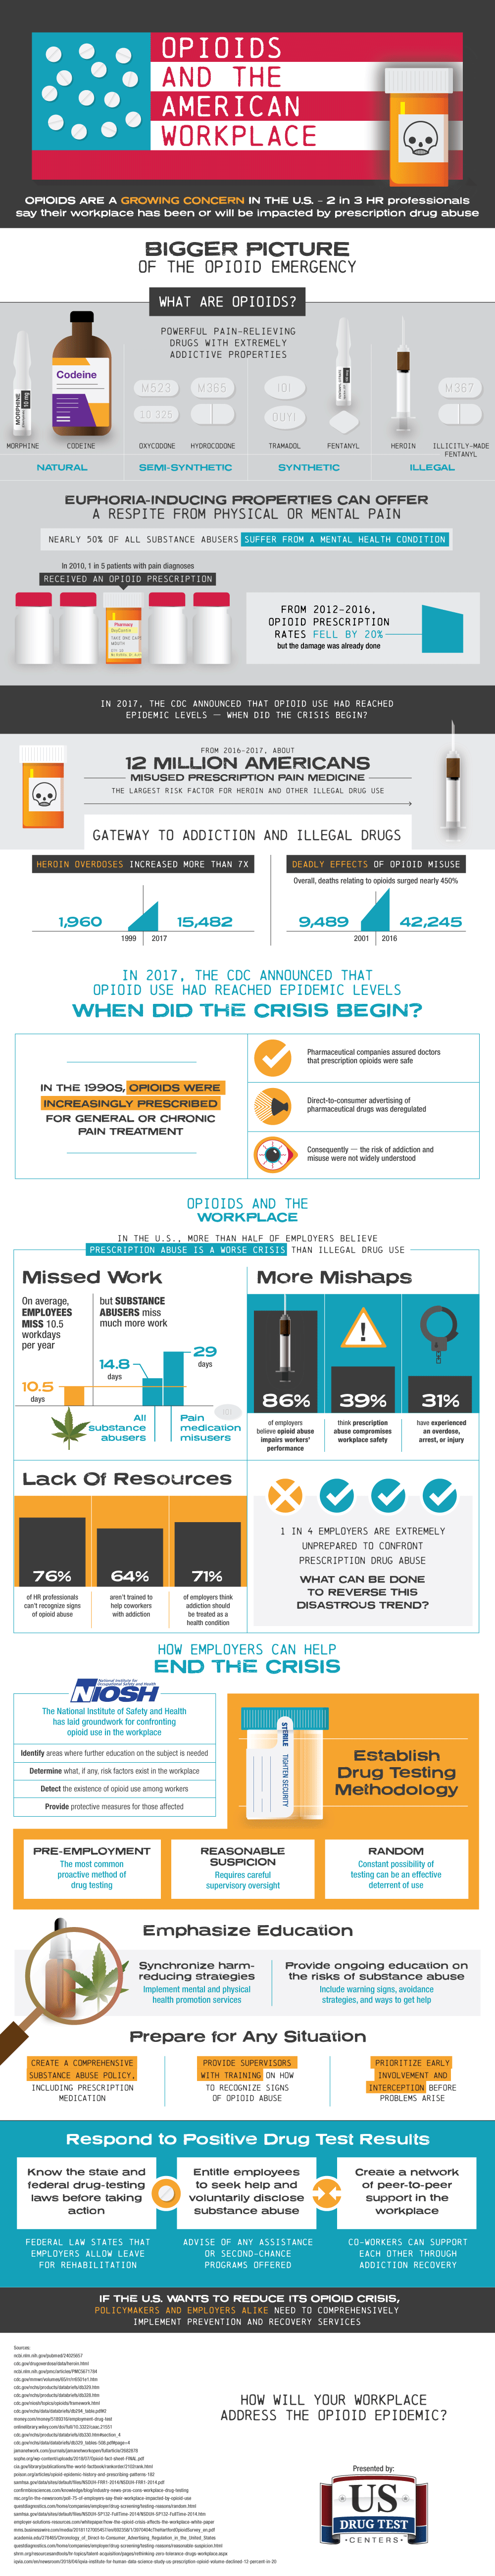
American adults engage in about 130 million episodes [1] of drunken driving in an average year, according to research from the federal Centers for Disease Control and Prevention despite the specter of accidents, fines and arrests.
While obviously, the risk of causing an accident is the most important reason to avoid drinking and driving (about 30 Americans per day [2] are killed in drunk-driving accidents), the legal ramifications of a drunk-driving conviction can be very serious — fines, lost wages, potentially even removal from your job.
Even a first offense could carry total costs of as much as $25,000 [3], depending on factors like the level of impairment, treatment and education classes ordered, attorneys fees and random testing requirements.
Just over 1 million people were arrested for driving under the influence in 2018 [4], according to new data released by the FBI, accounting for nearly 1 in 10 of the total arrests made across the entire country that year. Drunk-driving arrests and DUIs, which includes driving while under the influence of any substance, are more common than arrests for aggravated assault, burglary, auto theft or fraud.
While the number of DUI arrests has declined overall in the U.S. over the past five years [5], several states have disturbingly high rates of drunken-driving arrests and some have seen such arrests become more common over the years. Where are DUI arrests more likely, and where does your state stand in the mix? To understand, we’ll take a look at data from the FBI’s most recent update, Crime in the U.S. 2018, as well as the past several years of the report.
Demographics of Drunken Driving
U.S. law enforcement agencies reported more than 1.01 million arrests for DUI in 2018, according to FBI data, which is a decline from 2014 levels but represents a modest 1% increase from 2017. [6]
Men are far more likely than women to be arrested for DUI [7]. In arrests where the suspect’s sex was reported, men accounted for nearly 3 in 4 DUI arrests in 2018. However, both men and women have seen their DUI arrest totals fall over the past 10 years.
Click to enlarge image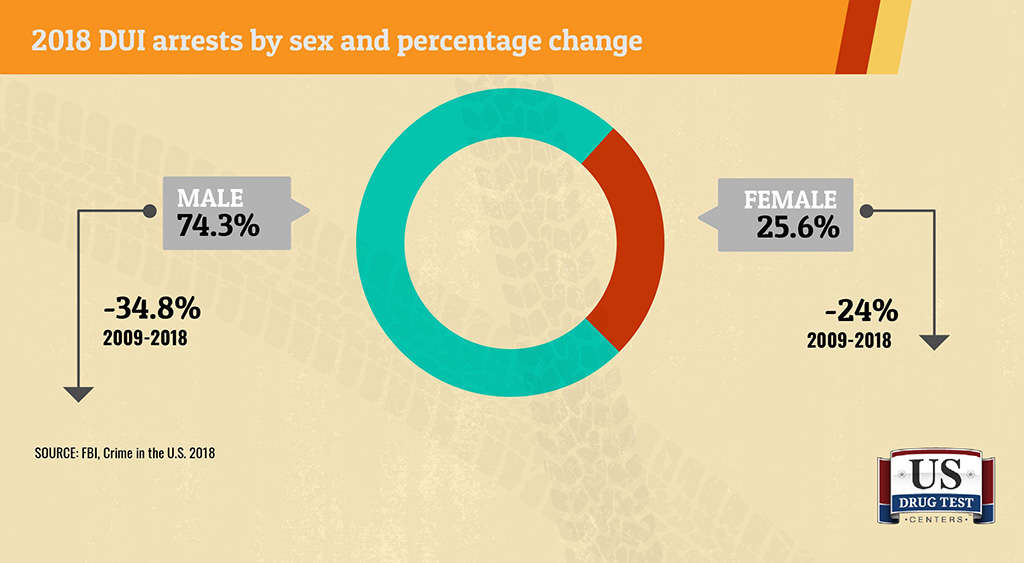
2018 DUI arrests by sex and percentage change*
Sex % of arrests Change
Male 74.3% -34.8%
Female 25.6% -24%
*2009-2018
White people account for the vast majority of DUI arrests in which the suspect’s race were reported, making up more than 80% of DUI arrests [8].
Click to enlarge image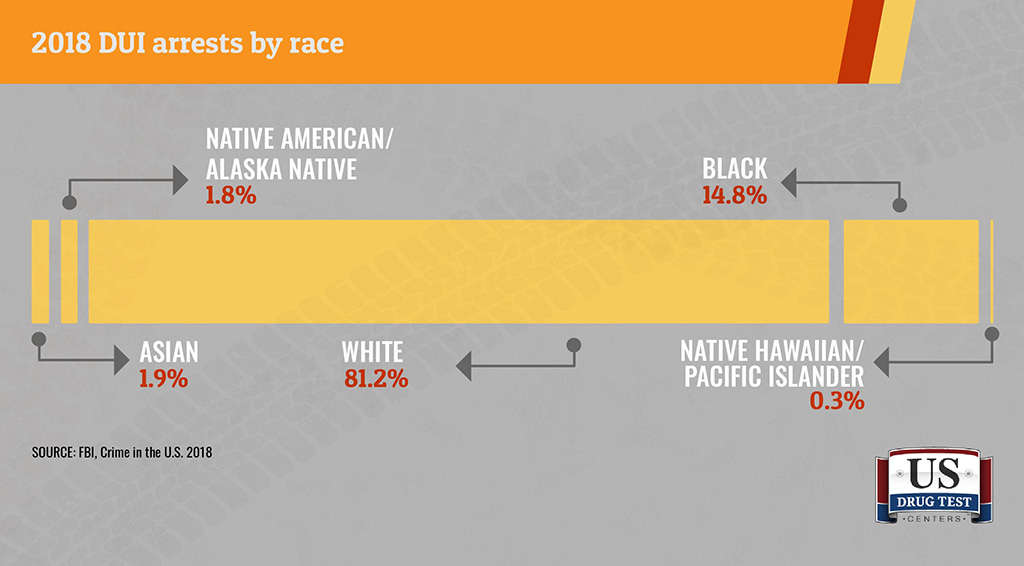
2018 DUI arrests by race
White 81.2%
Black 14.8%
Asian 1.9%
Native American/Alaska Native 1.8%
Native Hawaiian/Pacific Islander 0.3%
Adults in their 20s make up the largest proportion of DUI arrestees by age group (in incidents where the suspect’s age was reported), accounting for about 1 in 3 DUI arrests [9]. Those 60 and older make up only about 5.9% of arrests.
Click to enlarge image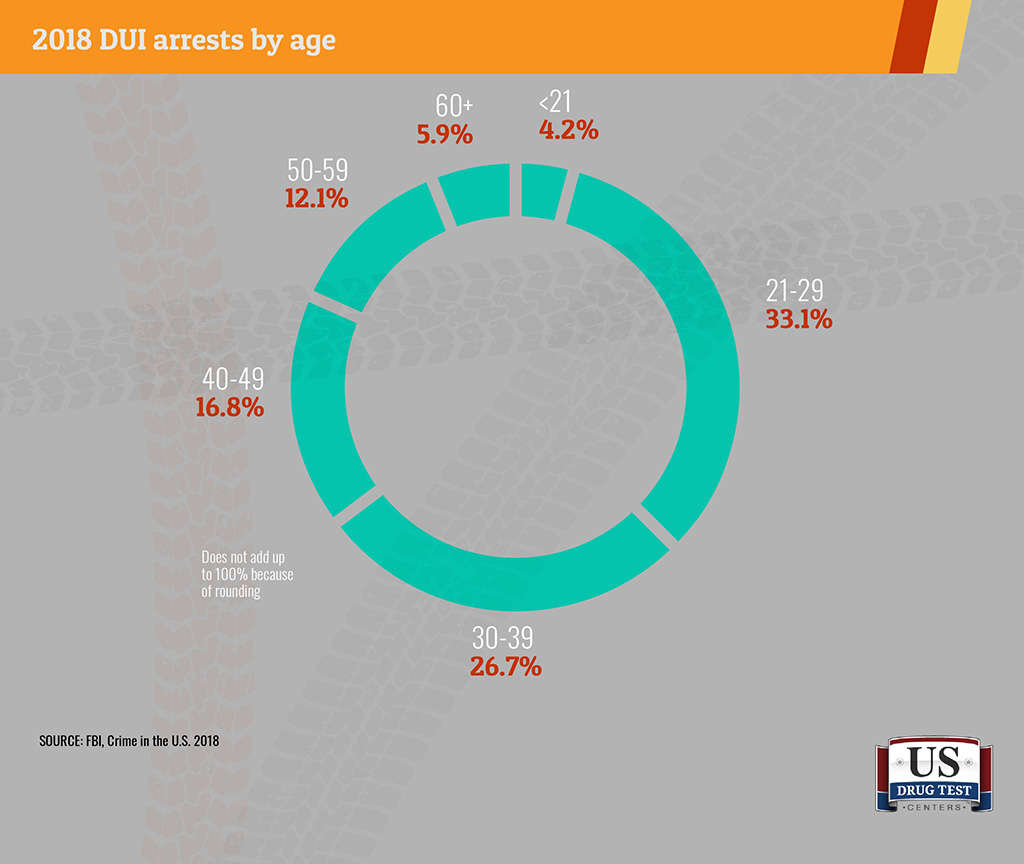
2018 DUI arrests by age group
<21 4.2%
21-29 33.1%
30-39 26.7%
40-49 16.8%
50-54 12.1%
60+ 5.9%
Where Arrests Are Most Common
DUI arrests occur in the U.S. at a rate of 301.3 per 100,000 [10], but in several states, drunken-driving arrests are more than twice as common, while other states see much lower rates [11].
Click to enlarge image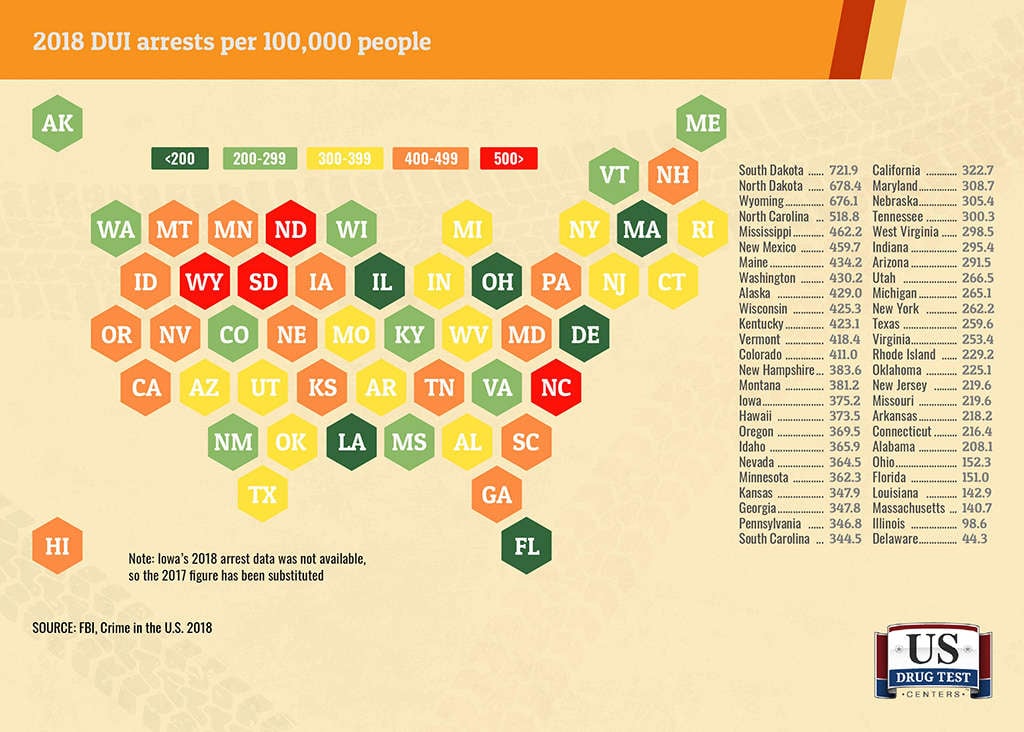
Note: Iowa’s 2018 arrest data was not available, so the 2017 figure has been substituted
A total of 28 states have DUI arrest rates higher than the overall U.S. rate, with three — South Dakota, North Dakota and Wyoming — producing rates that are at least double the overall national rate. Two states have DUI arrest rates that are below 100 per 100,000 — Illinois at 98.6 and Delaware at 44.3, giving that state the nation’s lowest DUI arrest rate.
Arrests for drunken driving are far more common in the West than in other regions of the country, with that region being the only one with a DUI arrest rate that eclipses the overall U.S. rate. The DUI arrest rate in the West is 346 per 100,000, followed by the South at 291, the Midwest at 280 and the Northeast at 269.
We’ll explore more in the next section about how most states have been able to lower their DUI arrest rates in recent years, but there are a handful of states that have made multiple appearances among the top 10 for DUI rates over the past decade. Three of the top 10 states in 2018 have been in the top 10 every year since 2009 — Mississippi, South Dakota and Wyoming [12].
Click to enlarge image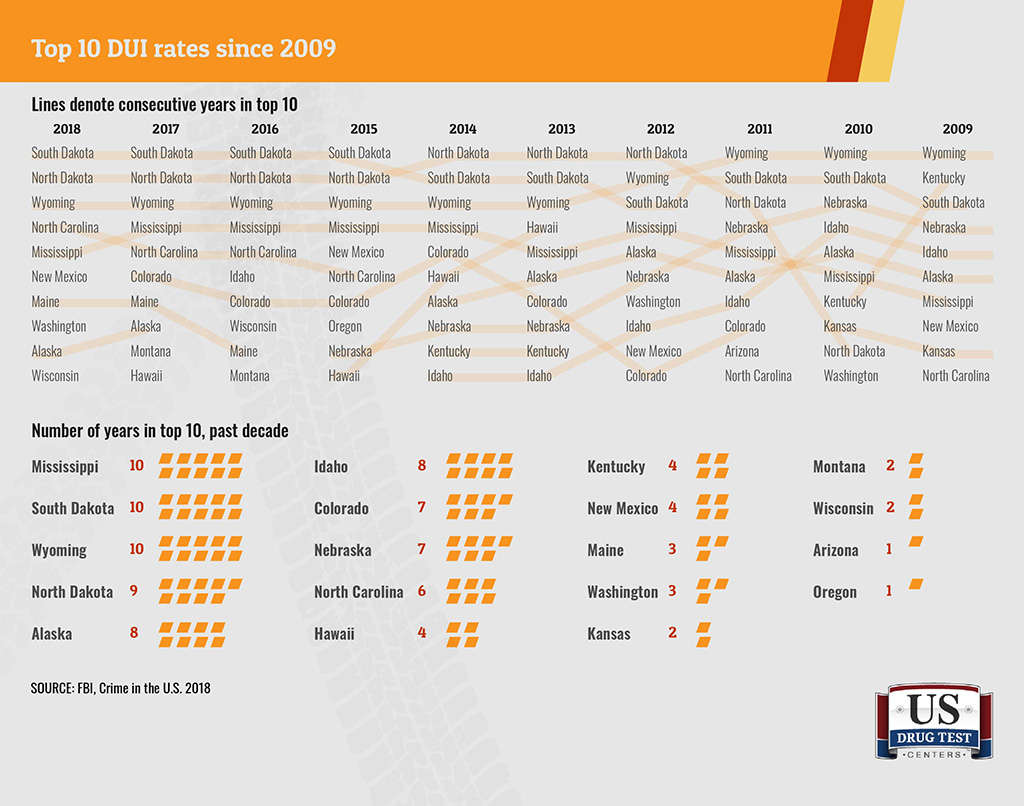
Since 2009, 19 states have made an appearance among the top 10 for DUI arrest rates with all but two states showing up more than once.
Where Have Arrest Rates Risen?
The United States has seen the population-adjusted rate of DUI arrests fall by more than 35% since 2009, and the rate has dropped by nearly 15% in just the past five years. Similarly, most states have seen drunk-driving arrest rates fall, though fewer have recorded drops since 2014 than when taking the longer view.
Three states — Delaware, Washington and North Dakota recorded increases in the population-adjusted rate of DUI arrests over the 10-year period between 2009 and 2018, the only states to do so. But Delaware’s rate in 2018 was still the lowest in the country.
Click to enlarge image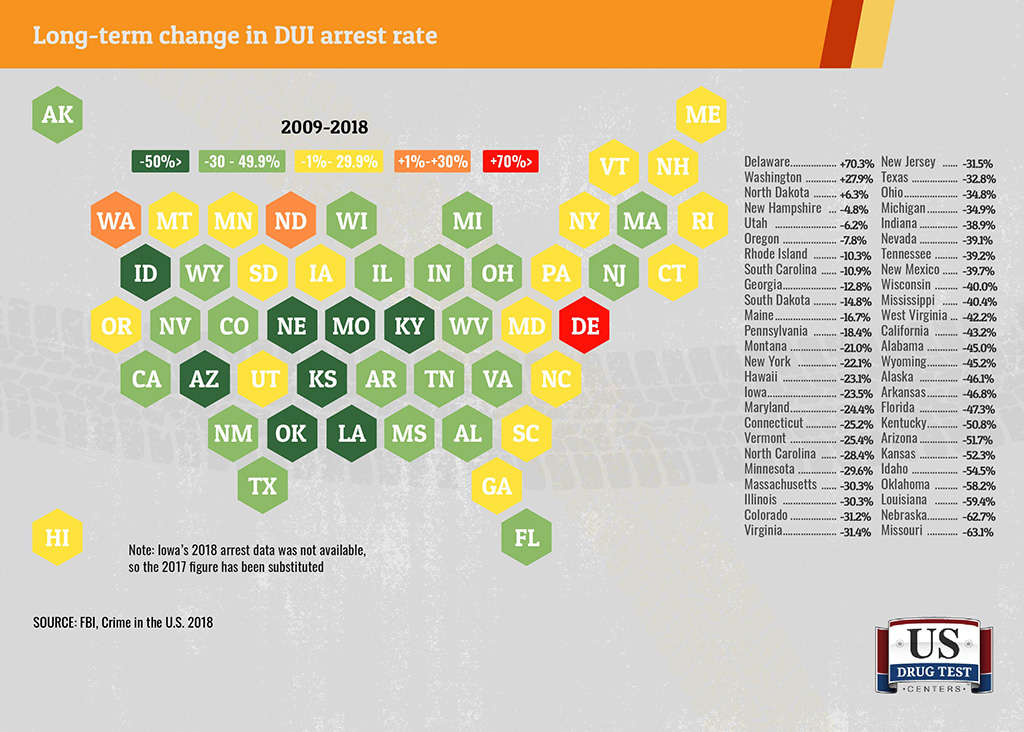
Over the short term, many more states have seen their DUI arrest rates climb, though the majority of states have managed to record a drop since 2014. Still, of the 14 states where rates have climbed, four of them — Georgia, South Carolina, Nevada and Oregon — increased their DUI arrest rates by more than 25%. The solid majority of states managed to lower their DUI arrest rates, led by the -62.5% decline posted by Ohio. Among states where the rate fell, the average decline was -18.5%, and the average increase was 14%.
Click to enlarge image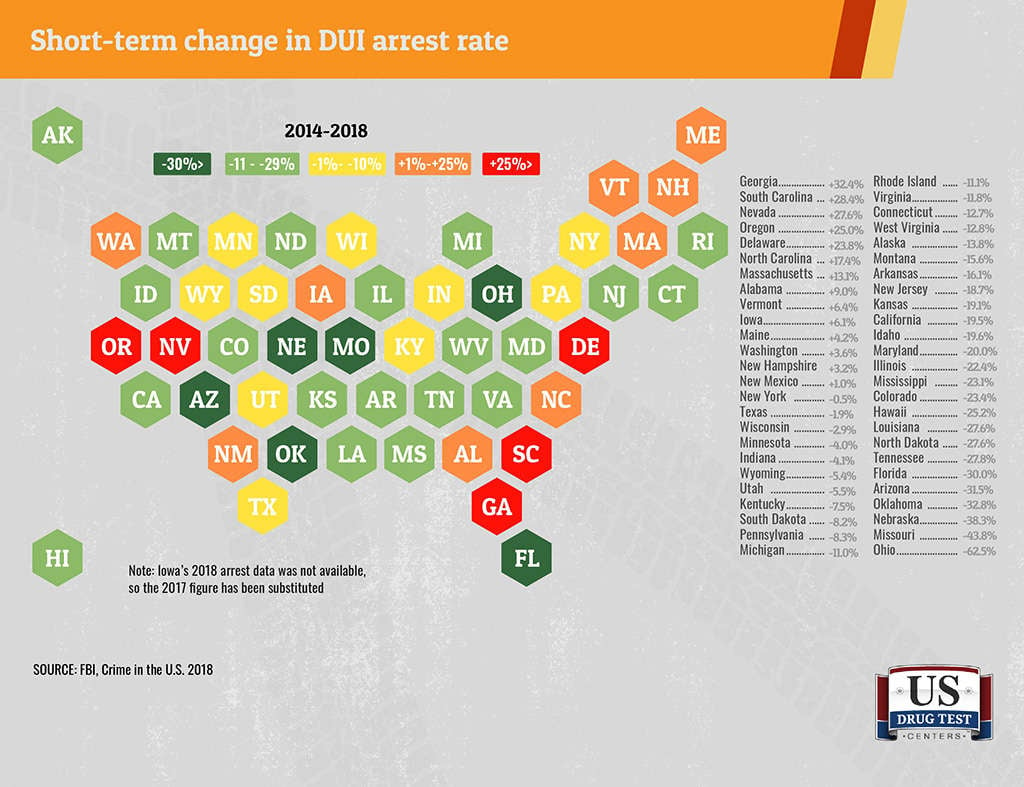
Most states have seen DUI arrest rates that are above the current national rate at some point in the past 10 years, and for the vast majority of them, 2009 was the peak year of the past decade. Thirty-five states marked their peak DUI year in 2009, while five peaked in 2010, two each in 2011, 2012 and 2013 and one each in 2014, 2015, 2017 and 2018. No state had its peak year in 2016. What was your state’s peak DUI arrest rate in the past decade?
Click to enlarge image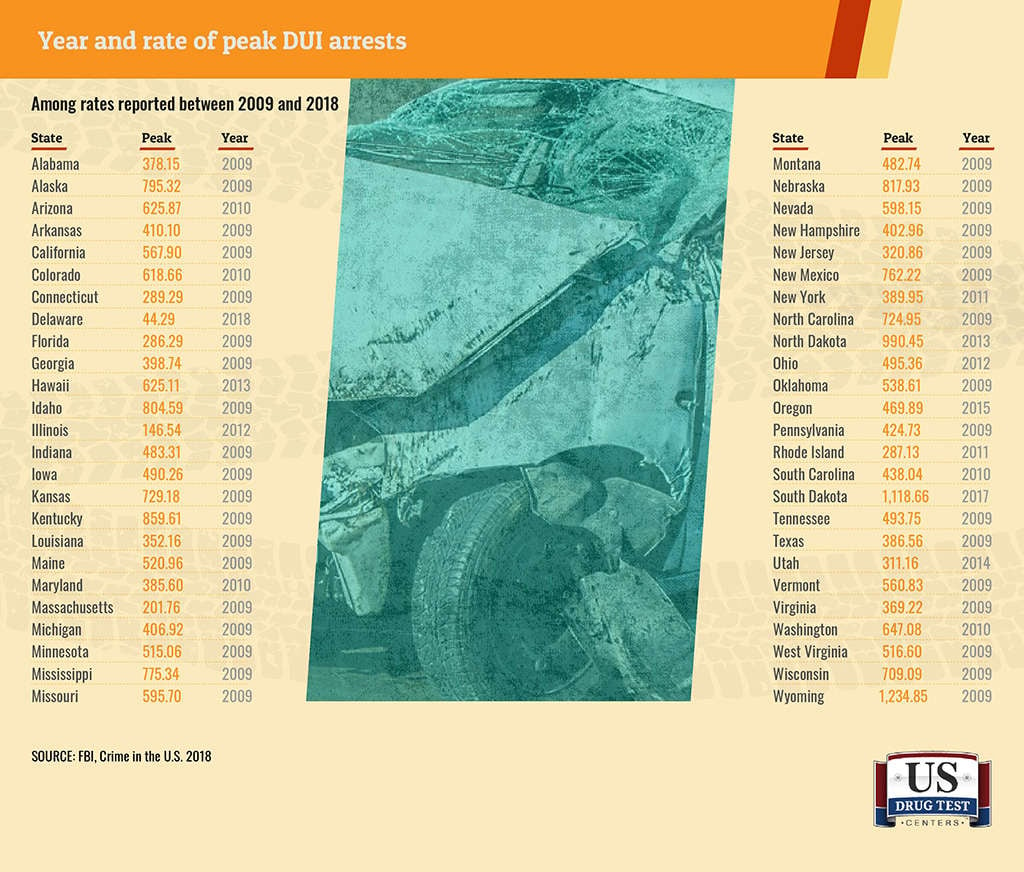
Conclusion
The good news in the FBI data on DUI arrests is that it appears that more people are getting the message that drinking and driving is too dangerous an activity to risk, but the bad news is that in several states, DUI arrests remain incredibly common. And there may always be people who are in the grips of alcohol dependence who truly cannot keep themselves from drinking and driving without intervention, such as alcohol treatment or court-mandated random alcohol testing.
About This Report
As we mentioned, all of the data on arrests for DUI, which includes driving under the influence of alcohol or another intoxicant, which could include marijuana in some states, came from the FBI’s annual Crime in the U.S. report. We included data from the 2018 version as well as all the reports since 2009. We excluded the District of Columbia from this study because data from the District is limited; additionally, 2018 data for Iowa was unavailable, so 2017 data was included instead for only that state.
Links to all data sources can be found below.
Fair Use Statement
Those interested in sharing the data, analysis and images on this page are free to do so for noncommercial uses, and those who do choose to share the information are asked to include a link to the URL at the top of this page.
Resources
[1] https://www.cdc.gov/mmwr/preview/mmwrhtml/mm6430a2.htm?s_cid=mm6430a2_w
[2] https://www.nhtsa.gov/risky-driving/drunk-driving
[3] https://www.alcohol.org/dui/financial-cost/
[4] https://ucr.fbi.gov/crime-in-the-u.s/2018/crime-in-the-u.s.-2018/topic-pages/tables/table-29
[5] https://ucr.fbi.gov/crime-in-the-u.s/2014/crime-in-the-u.s.-2014/tables/table-29
[6] https://ucr.fbi.gov/crime-in-the-u.s/2017/crime-in-the-u.s.-2017/topic-pages/tables/table-29
[7] https://ucr.fbi.gov/crime-in-the-u.s/2018/crime-in-the-u.s.-2018/tables/table-33
[8] https://ucr.fbi.gov/crime-in-the-u.s/2018/crime-in-the-u.s.-2018/tables/table-43
[9] https://ucr.fbi.gov/crime-in-the-u.s/2018/crime-in-the-u.s.-2018/tables/table-38
[10] https://ucr.fbi.gov/crime-in-the-u.s/2018/crime-in-the-u.s.-2018/topic-pages/tables/table-30
[11] https://ucr.fbi.gov/crime-in-the-u.s/2018/crime-in-the-u.s.-2018/topic-pages/tables/table-69